


 info@csceramic.com
1. Experimental part
1.1 Experimental instrument
DuPont 1090 thermal analyzer is used, thermal analysis sample crucible.
1.2 Experimental method
DSC: Determination of glass transition of polymers and their alloys;
TGA: Determination of thermal degradation, thermal oxidation degradation and constant temperature properties of polymers and their alloys;
TMA: Determination of expansion coefficient and deformation characteristics of ABS / PVC / NBR alloy.
2. Results and discussions
2.1 Glass Transition of ABS / PVC / NBR Alloy and its Components
DSC curves of ABS, PVC, NBR and ABS / PVC / NBR are shown in Figure 1.
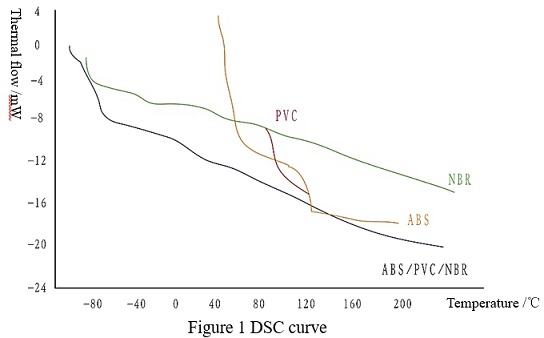
The compatibility of plastic alloy components is the key to good performance of plastic alloy, and glass transition temperature is an important parameter to characterize alloy compatibility. The glass transition temperatures of ABS, PVC, NBR and their alloys are listed in the table.
|
Sample name |
shop sign |
Composition |
Glass transition temperature / ℃ |
|
|
Gaoqiao ABS - R103 |
|
105 |
|
|
IMT-100 |
|
112, -85 |
|
Abs |
IH-100 |
|
109.6 |
|
|
Lanhua AS - 131 |
|
100 |
|
|
ABS-310 |
|
106 |
|
Pvc |
|
|
87.9 |
|
NBR |
Japan |
|
-29.4 |
|
|
Lanhua AS - 131 |
|
-15.7 |
|
ABS/PVC/NBR |
Germany 1# |
|
-81, -163, 44.8, 96.4 |
|
|
Shanghai 3# |
Gaoqiao ABS |
-74.4, -8.8, 98.8 |
|
|
Shanghai 4# |
Lanhua ABS |
-79.1, -7.3, 96.7 |
2.2 Thermal degradation and thermal oxygen degradation of ABS / PVC / NBR alloy
The TGA curves of ABS, PVC, NBR and their alloys under high purity nitrogen are shown in Figure 2.
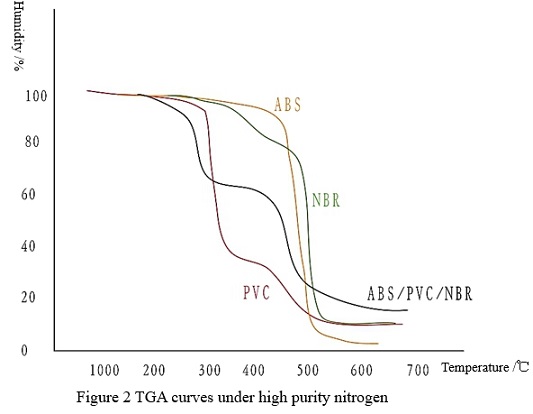
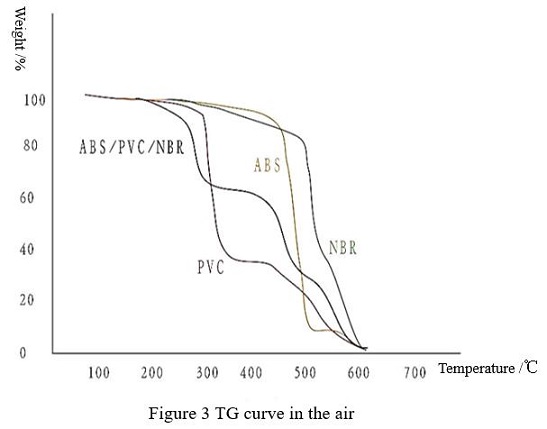
Figure 3 shows TG curves of ABS, PVC, NBR and their alloys in the air.
2.3 HCl removal and Constant Temperature Characteristics of ABS/PVC/NBR
Measurement of thermal degradation and oxidative degradation of ABS/PVC/NBR alloy shows that the weight loss of the first weightlessness step at 180 ~ 350℃ has no relation with the atmosphere, and the weight loss in air and nitrogen is similar (see Figure 4 ).
DSC curves of ABS, PVC, NBR and their alloys at constant temperature are shown in Figure 5, and the weight loss is listed in table 2.
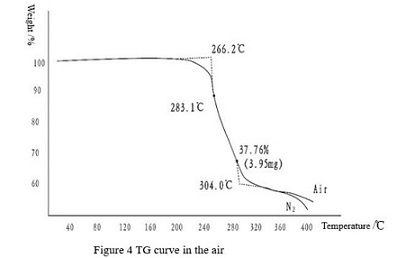
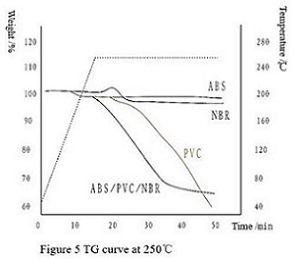
Table 2 Weight Loss of ABS, NBR and Their Alloys * %
|
Sample name |
200℃ |
250℃ |
||
|
N2 |
AIR |
N2 |
AIR |
|
|
ABS |
2.10 |
— |
2.10 |
2.10 |
|
NBR Lanhua |
— |
— |
2.35 |
4.66 |
|
Japan |
— |
— |
5.04 |
— |
|
ABS/PVC/NBR 1# |
3.30 |
3.47 |
32.00 |
31.67 |
|
ABS/PVC/NBR 2# |
4.23 |
4.02 |
27.50 |
33.16 |
|
ABS/PVC/NBR 3# |
5.67 |
4.90 |
29.00 |
31.82 |
|
ABS/PVC/NBR 4# |
6.61 |
6.66 |
— |
31.71 |
Keep constant temperature for 30 min
2.4 Deformation Characteristics of ABS/PVC/NBR Alloy
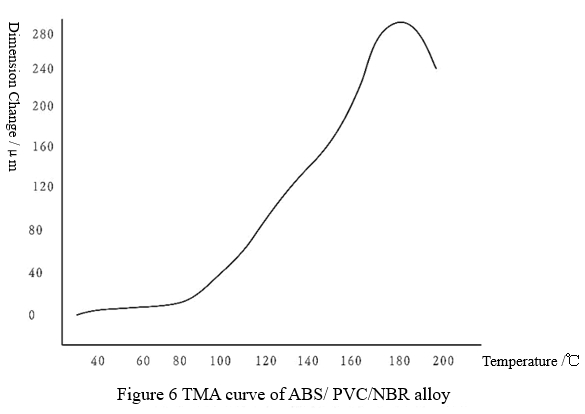
TMA curve of ABS/ PVC/NBR alloy is shown in Figure 6.
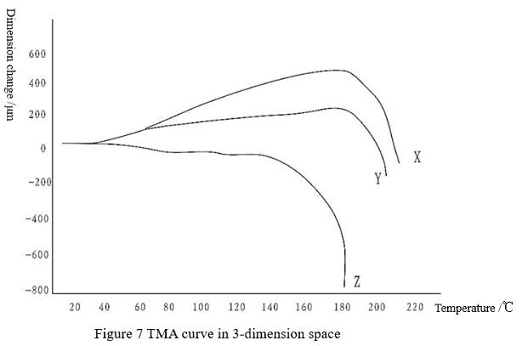
TMA curve of ABS/PVC/NBR in X, Y and Z three-dimensional space is shown in Figure 7. Deformation characteristics of the alloy are anisotropic, which is caused by stress concentration during extrusion molding. This factor should be considered in mold making and design of molding process.
3. Conclusions
a. Thermal analysis method is the most direct test method to study alloy transformation. Using thermal analysis consumables with stable quality can systematically characterize its thermal characteristics from the aspects of glass transition, thermal degradation, thermal oxygen degradation, HCl removal, deformation.
b. Glass transition temperature is an important parameter to characterize the compatibility of plastic alloys.
c. Thermal degradation and thermal oxygen degradation of ABS/PVC/NBR show that thermal stability of the alloy depends on the HCl removal process of PVC in the alloy system.
d. TMA curve of ABS/PVC/NBR has three sections, flat section is suitable temperature range for usage, while expansion section will deform the product and lose its practical value, and softening section will provide reliable technical data and theoretical basis for determining the optimal process.


 +86 18273288522