


 info@csceramic.com
Abstract: DSC, TGA and TMA techniques are used for systematical study of glass transition, thermal degradation, thermal oxygen degradation, HCl removal process and deformation characteristics of ABS / PVC / NBR alloys. The results show that various changes in ABS / PVC / NBR alloy are accompanied by changes in energy, mass and dimension. Glass transition temperature is an important parameter to characterize the compatibility of plastic alloys. Thermal stability of the alloy depends on HCl removal process of PVC in the alloy system. TMA curve of ABS/PVC/NBR is divided into flat section, expansion section and softening section, in expansion section products will deform and lose practical value. Flat section belongs to the application scope, and softening section provides technical data and theoretical basis for determining the optimal process.
ABS/PVC/NBR is a new type of polymer material, which is widely used for bags, automobile panels and other outer packaging products. Its thermal behavior and thermal stability are related to processing and performance. Therefore, it’s necessary to carry out study of thermal properties of ABS/PVC/NBR alloy.
1. Experimental part
1.1 Experimental instrument
DuPont 1090 thermal analyzer is used, thermal analysis sample crucible.
1.2 Experimental method
DSC: Determination of glass transition of polymers and their alloys;
TGA: Determination of thermal degradation, thermal oxidation degradation and constant temperature properties of polymers and their alloys;
TMA: Determination of expansion coefficient and deformation characteristics of ABS / PVC / NBR alloy.
2. Results and discussions
2.1 Glass Transition of ABS / PVC / NBR Alloy and its Components
DSC curves of ABS, PVC, NBR and ABS / PVC / NBR are shown in Figure 1.The position of the sudden change of the baseline to the endothermic direction in the curve is the glass transition of the polymer, which indicates that the ice-bound segment in the amorphous polymer is active and has a sudden change in heat capacity.
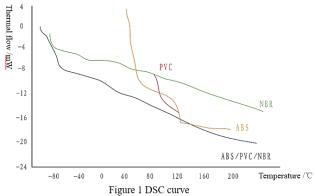
The compatibility of plastic alloy components is the key to good performance of plastic alloy, and glass transition temperature is an important parameter to characterize alloy compatibility. The glass transition temperatures of ABS, PVC, NBR and their alloys are listed in the table.
The glass transition temperatures of AB SIMT-100 are -85℃ and 112℃, PVC is 87.9℃, and NBR is -29.4℃, when the three materials were blended, the glass transition temperatures get closed with each other, they are -74.4℃, -8.8℃, -98.8℃ respectively, indicating that rubber phase is partially compatible with plastic phase. Solubility parameters of NBR and PVC are similar and have thermodynamic compatibility. In the blending process, it is possible to be compatible completely and form a new " phase" so that the glass transition temperature of PVC and NBR itself disappears, resulting in a new glass transition temperature. The glass transition temperature of the new phase is - 8.8℃, while the glass transition temperature of PS in ABS drops to 98.8℃.
The so-called rubber toughened plastic is that in plastic matrix, which is of high glass transition temperature, with dispersion of rubber phase that has low glass transition temperature. NBR plays this role in alloy and concentrates stress when it is above the glass transition temperature. The low temperature glass transition temperature of ABS / PVC / NBR is -74.4℃, -8.8℃, and rubber particles play a toughening role for styrene in the range of -74.4 ℃ (-8.8℃) ~ 98.8 ℃.
|
Sample name
|
shop sign
|
Composition
|
Glass transition temperature / ℃ |
|
|
Gaoqiao ABS - R103 |
|
105 |
|
|
IMT-100 |
|
112, -85 |
|
Abs |
IH-100 |
|
109.6 |
|
|
Lanhua AS - 131 |
|
100 |
|
|
ABS-310 |
|
106 |
|
Pvc |
|
|
87.9 |
|
NBR |
Japan |
|
-29.4 |
|
|
Lanhua AS - 131 |
|
-15.7 |
|
ABS/PVC/NBR |
Germany 1# |
|
-81, -163, 44.8, 96.4 |
|
|
Shanghai 3# |
Gaoqiao ABS |
-74.4, -8.8, 98.8 |
|
|
Shanghai 4# |
Lanhua ABS |
-79.1, -7.3, 96.7 |
Different shop signs of rubber have different glass transition temperature, also different toughening effect in alloy. Because when the temperature drops to glass transition, micro-Brownian motion of the chain segment is frozen, the material used as rubber loses high elasticity and becomes hard and brittle plastic, thus losing its toughening effect to plastic. The glass transition temperature of Japan and Lanhua NBR are -29. 4, -15. 7℃ respectively.
The DSC curves of different shop signs of ABS / PVC / NBR alloys are similar in shape. There are two components in the ABS / PVC / NBR alloy with low temperature glass transition temperature, those are butadiene phase in ABS and NBR phase added. Regarding low-temperature glass transition temperature of the alloy, Germany 1# is the lowest (16.3℃), and for Shanghai 3#, Shanghai 4# are –8.8, -7.3℃ respectively. Therefore, it can be considered that the toughening temperature range of the former is wider than that of the latter two.
2.2 Thermal degradation and thermal oxygen degradation of ABS / PVC / NBR alloy
The thermal stability of polymers can be characterized by decomposition temperature, which is closely related to the dissociation energy of the weakest bond in the polymer chain structure, that is, the chemical structure of the polymer itself determines its thermal decomposition characteristics.
The TGA curves of ABS, PVC, NBR and their alloys under high purity nitrogen are shown in Figure 2. The weightlessness step of 180 ~ 350℃ is mainly caused by HCl removal from PVC in ABS / PVC / NRR alloy. Because the weight loss of pure PVC in this temperature range is above 60 %, and thermal degradation of ABS and NBR occurs above 350℃, it is considered that the weight loss under 350 ℃ in plastic alloy is mainly caused by HCl removal in PVC, and the thermal stability of plastic alloy mainly depends on PVC in the mixed system.
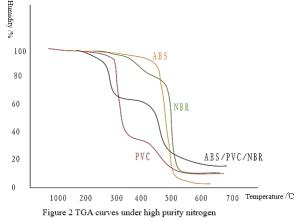
In TGA curves of ABS / PVC / NBR alloys of different shop signs, the first weightlessness step is mainly due to PVC HCl removal, the weight loss varies depending on the PVC content in the alloy. Pure PVC is 61.7 %, in Germany 1# alloy is 41.13 %, 43.04 % for Changchun 2# alloy and 38.89 % for Shanghai 3# alloy. To some extent, weight loss reflects the difference in alloy composition and performance.
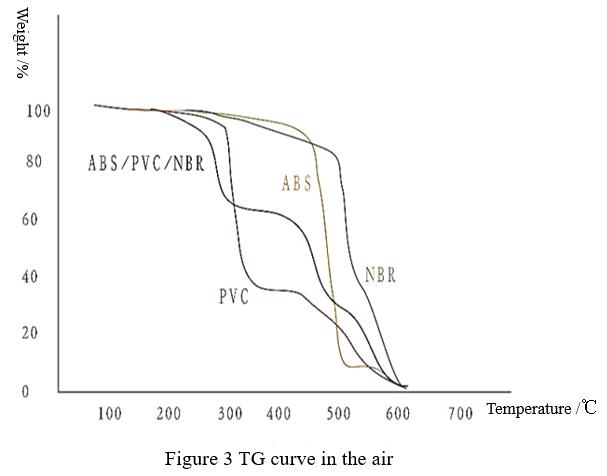
The degradation of plastic alloy is a typical structural change. It is degraded by chemical reaction with substances in the environment. The most important degradation agent is oxygen. Oxidation reaction can induce and accelerate degradation when heated. Figure 3 shows TG curves of ABS, PVC, NBR and their alloys in the air. The weightlessness step of 180 ~ 350℃ in ABS / PVC / NBR alloy is still degradation of PVC by HCl removal. Pure ABS has a slow weight loss from 240℃ to 350℃ with a cumulative weight loss of only 4.98 %. NBR has an oxidation weight gain at 220℃, by a 4.56 % weight loss step. The fluorination degradation process of both occurs mainly at 350 ~ 550℃. For the alloy, all ABS/PVC/NBR alloys have two continuous weightlessness steps due to the formation of oxidation intermediates and their further degradation. The residue is also less than that produced by thermal degradation under nitrogen flow, about 4% ~ 5%.
2.3 HCl removal and Constant Temperature Characteristics of ABS/PVC/NBR
Measurement of thermal degradation and oxidative degradation of ABS/PVC/NBR alloy shows that the weight loss of the first weightlessness step at 180 ~ 350℃ has no relation with the atmosphere, and the weight loss in air and nitrogen is similar (see Figure 4 ). That is to say, in this temperature range, thermal degradation, i.e. PVC HCl removal process is dominant, so it is instructive to select this temperature range for constant temperature test.
DSC curves of ABS, PVC, NBR and their alloys at constant temperature are shown in Figure 5, and the weight loss is listed in table 2.
The weight loss of ABS/PVC/NBR alloy at 250℃ is 31.82 %, while the weight loss of ABS and NBR at 250℃ is 2.1% ~ 2.4% and 2.3% ~ 4.6% respectively, accounting for only 1/6 of the total loss weight of the alloy. The weight loss of alloy at constant temperature is mainly caused by HCl removal from PVC, while the weight loss at 250℃ for 30 min is much higher than that at 200 ℃. In the process of processing, if the process conditions change and the temperature is not properly controlled, a large amount of HCl will be removed from the alloy and the alloy properties will be lost. Therefore, the loss of weight of alloy at 200 ℃ reflects advantages and disadvantages of thermal stability to some extent.
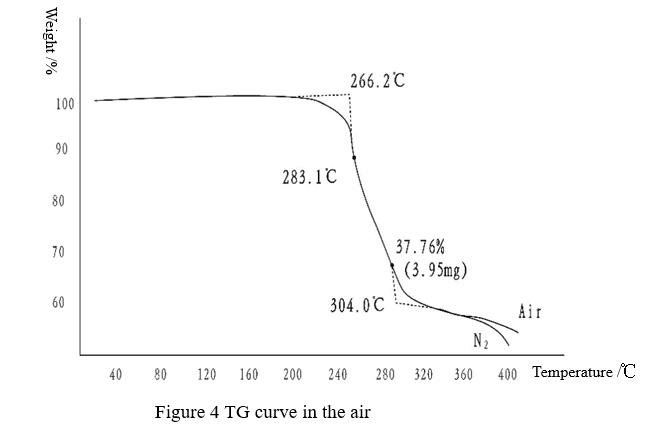
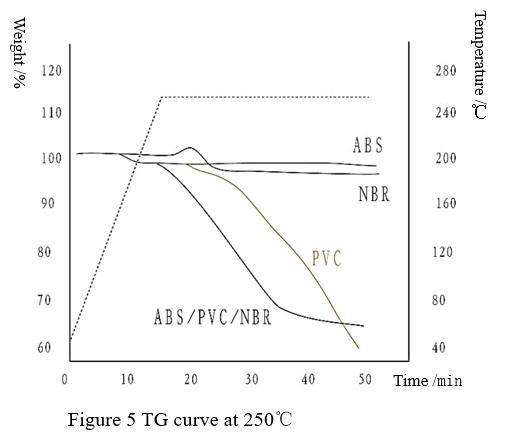
Table 2 Weight Loss of ABS, NBR and Their Alloys * %
|
Sample name |
200℃ |
250℃ |
||
|
N2 |
AIR |
N2 |
AIR |
|
|
ABS |
2.10 |
— |
2.10 |
2.10 |
|
NBR Lanhua |
— |
— |
2.35 |
4.66 |
|
Japan |
— |
— |
5.04 |
— |
|
ABS/PVC/NBR 1# |
3.30 |
3.47 |
32.00 |
31.67 |
|
ABS/PVC/NBR 2# |
4.23 |
4.02 |
27.50 |
33.16 |
|
ABS/PVC/NBR 3# |
5.67 |
4.90 |
29.00 |
31.82 |
|
ABS/PVC/NBR 4# |
6.61 |
6.66 |
— |
31.71 |
Keep constant temperature for 30 min
2.4 Deformation Characteristics of ABS/PVC/NBR Alloy
TMA curve of ABS/ PVC/NBR alloy is shown in Figure 6.
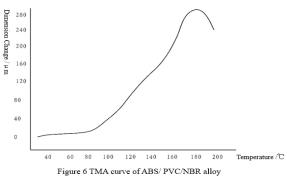
TMA curve is divided into flat section, expansion section and softening section. The flat section is from room temperature to 80 ℃, i.e. the usual usage temperature range, and the alloy expansion coefficient is 100~200μm/(m·℃ ). 80~180℃ is the expansion section, which may be caused by rubber expansion. Although the alloy has not undergone thermal degradation or thermal oxygen degradation, the temperature increase causes the polymer to expand in volume, increasing the free space between molecules, and activating the chain segment and even the whole molecule. Because the volume expansion will cause the geometric shape change, if the geometric shape changes arbitrarily despite of people's willing, the product will lose its practical value. Only in the softening section, the alloy has the characteristics of viscous flow of high polymer, and it’s necessary parameters for process and formation. The softening temperature starts at 170℃, from ABS/PVC/NBR alloy low temperature ( - 65~0℃) TMA curve, it can be observed that the alloy shows a flat potential at low temperature with no obvious change in geometric dimensions and an expansion coefficient of 45~114μm/(m·℃), so it is considered that the alloy also has use value at low temperature and can be used as material for vessels such as refrigeration vessels.
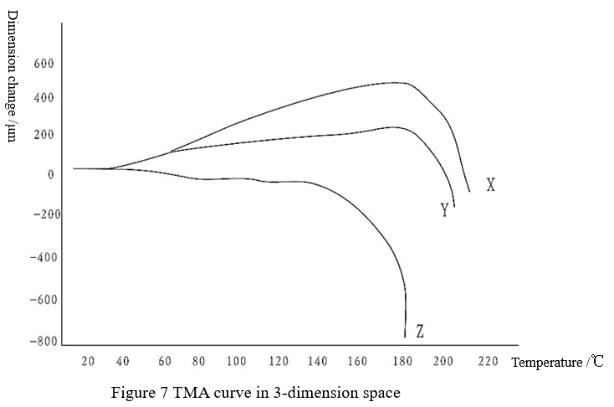
TMA curve of ABS/PVC/NBR in X, Y and Z three-dimensional space is shown in Figure 7. Deformation characteristics of the alloy are anisotropic, which is caused by stress concentration during extrusion molding. This factor should be considered in mold making and design of molding process.
3. Conclusions
a. Thermal analysis method is the most direct test method to study alloy transformation. Using thermal analysis consumables with stable quality can systematically characterize its thermal characteristics from the aspects of glass transition, thermal degradation, thermal oxygen degradation, HCl removal, deformation and so on. It is the basis for studying the relationship between ABS/PVC/NBR processing process, structure and properties.
b. Glass transition temperature is an important parameter to characterize the compatibility of plastic alloys. Low-temperature glass transition of ABS/PVC/NBR alloy is -81℃, -16.3℃, and high-temperature glass transition is 96.4℃ (98.8℃). The difference in glass transition temperature reflects the compatibility of the alloy system and provides a technical basis for the selection of formula synthesis process.
c. Thermal degradation and thermal oxygen degradation of ABS/PVC/NBR show that thermal stability of the alloy depends on the HCl removal process of PVC in the alloy system. The weight loss of German and Shanghai samples at 250℃ for 30mins is much higher than that of the samples at 200℃. To some extent, weight loss of the alloy at the constant temperature of 200℃ reflects thermal stability of the alloy during processing.
d. TMA curve of ABS/PVC/NBR has three sections, flat section is suitable temperature range for usage, while expansion section will deform the product and lose its practical value, and softening section will provide reliable technical data and theoretical basis for determining the optimal process.


 +86 18273288522