


 info@csceramic.com
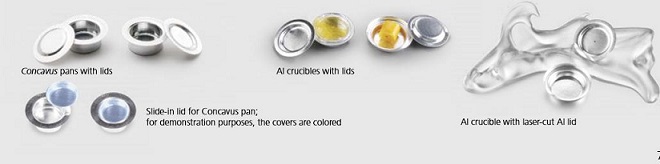
Thermal analysis has been applied in many fields, and various materials and sizes of thermal analysis sample pans have appeared accordingly.Its effectiveness can be obtained not only academically but also industrially.As an application field, inorganic materials such as metals, minerals, ceramics, glass and high molecular materials such as plastics and rubber are self - evident, and all substances such as medicine, food, cosmetics and biology have become the objects of thermal analysis.
From the side of material evaluation, the following introduces typical application examples based on typical measurement and analysis examples.
Application Example of 4 - 1 DSC
Measurement of Glass Transition of 4 - 1 - 1 Polystyrene
The DSC measurement results of 8 monodisperse polystyrenes with different molecular weights are shown in fig. 10.Using DSC, the glass transition phenomenon that the baseline moves toward the endothermic direction can be observed.The glass transition temperature ( Tg ) can be determined from the observed temperature at which the baseline moves.As can be seen from the results of fig. 10, the higher the molecular weight, the higher the glass transition temperature of polystyrene.
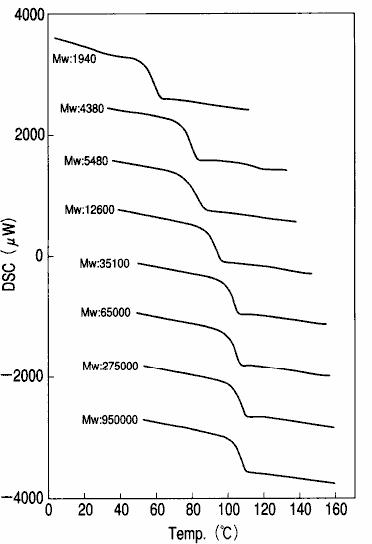
Fig. 10 DSC measurement results of polystyrene
Melting Measurement of 4 - 1 - 2 Polyethylene
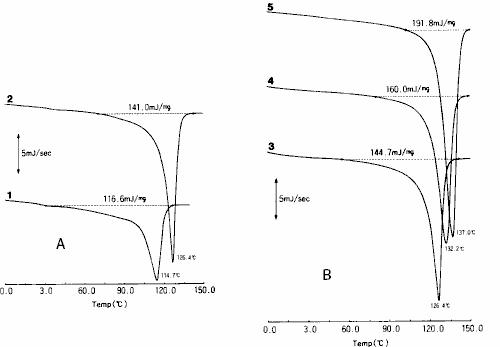
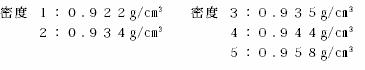
The DSC measurement results of five kinds of polyethylene with different densities are shown in fig. 11.In DSC method, the melting temperature ( Tm ) can be calculated from the temperature observed at the peak during melting, and the melting heat ( △ hm ) can also be calculated from the peak area.
Fig. 11 DSC measurement results of polyethylene a: low density polyethylene b: high density polyethylene
As shown in fig. 12, the peak temperature and the relationship between heat and density are obtained from the measurement results in fig. 11.From these results, it can be seen that the melting temperature and heat of polyethylene vary with the density, and the higher the density, the higher the melting temperature and heat will be.
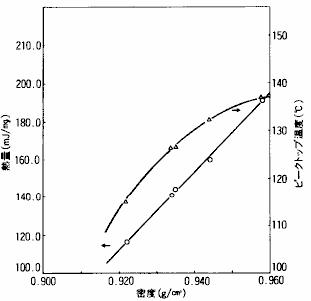
Fig. 12 relationship between melting temperature and melting heat of polyethylene and density
Specific heat capacity measurement
In addition to measuring the temperature and heat of material transformation, melting and reaction, the specific heat capacity ( CP ) can also be determined by DSC measurement using a thermal analysis sample tray.
Fig. 13 shows the principle of calculating specific heat capacity by DSC measurement in a mathematical model.The empty container and the unknown sample, as well as the reference substance with known heat capacity, were measured under the same conditions. according to the DSC data obtained.
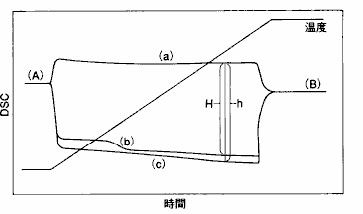
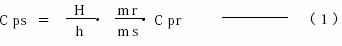
13 ( a ), ( b ) and ( c ) ), the specific heat capacity ( CP ) of the unknown sample can be obtained using the following formula.
Fig. 13 DSC method to measure specific heat capacity
DSC curve of empty container
DSC curves of unknown samples
DSC curve of reference substance
CPS: Specific Heat Capacity of Unknown Sample
CPR: Specific Heat Capacity of Reference
MS: Unknown sample weight
MR: The weight of the reference substance
H: Difference between unknown sample and empty container H: Difference between reference and empty container
As an example of the results of measuring specific heat capacity using this method, fig. 14 shows the results of measuring and analyzing polystyrene.
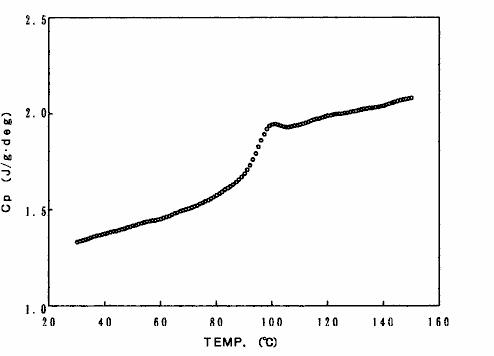
Fig. 14 specific heat capacity measurement results of polystyrene
Examples of TG / DTA Applications
Thermal Decomposition Measurement of Polymer
Because the decomposition of polymer is accompanied by weight change, when evaluating the heat resistance and thermal stability of polymer, a TG/DTA Sample Pan is usually used and TG measurement is usually used.
The TG measurement results of various polymers are shown in fig. 15.There are 7 kinds of samples: polyvinyl chloride ( PVC ), polyacetal ( POM ), epoxy resin ( EP ), polystyrene ( PS ), polypropylene ( PP ), low density polyethylene ( LDPE ) and polytetrafluoroethylene ( PTFE ).It can be seen from the figure that the decomposition initiation temperature and decomposition behavior of different kinds of polymers are different.
Thermal Decomposition Measurement of Rubber
The TG / DTA measurement results of chloroprene rubber doped with carbon black are shown in fig. 16.The measurement process is that the temperature is first raised to 550 ℃ in the nitrogen medium, then temporarily lowered to 300 ℃, the gas medium is replaced by air, and the temperature is raised to 700 ℃ again. As a result, the thermal decomposition of polymer components mainly occurs in the nitrogen medium.Oxidative decomposition of carbon black occurs in air medium.In this way, the quantitative analysis of the separation of various components can be carried out according to the reduction in the weight of various substances and the residue ( ash ).
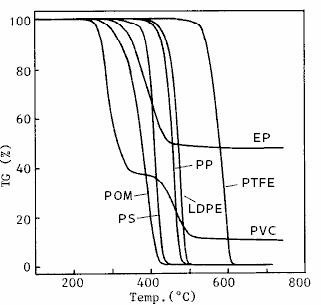
Fig. 15 TG measurement results of polymer
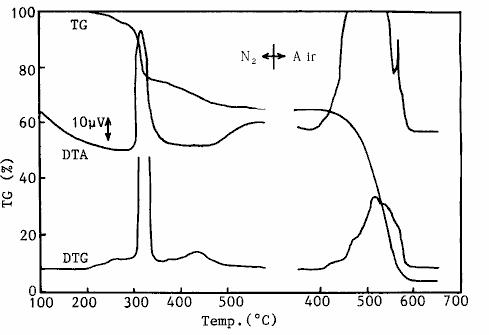
Fig. 16 TG / DTA measurement results of chloroprene rubber theoretical analysis of activation energy of 4 - 2 - 3 reaction
As a means to evaluate the heat resistance of polymer materials in a short time, the method is to analyze the thermal analysis measurement results by TG using the reaction activation energy theory. Up to now, several analysis methods have been reported.The " Ozawa method" is the most widely used and common theoretical analysis method of reaction activation energy.By " Ozawa method", the activation energy ( △ EA ) at the reaction time and the reaction time reaching a certain ratio ( constant temperature aging time ) at the constant temperature can be obtained from TG measurement data at three or more heating rates.
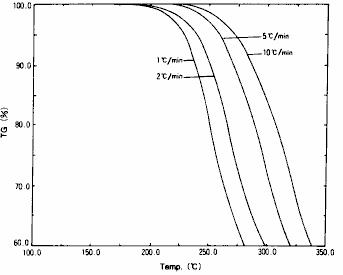
As shown in fig. 17, TG measurement results of insulating materials mainly composed of polymers are shown.This is the measurement result under four heating rates. It can be seen from this result that the decomposition temperature is different with different heating rates.For the initial process part of decomposition of these TG data ( part with 5 % weight reduction ), the results of theoretical analysis of reaction activation energy using " Ozawa method" are shown in fig. 18.As a result of the analysis, the activation energy of the decomposition reaction is 113 kJ / mol.In addition, assuming that the insulating material is kept at a constant temperature of 150.d egree. C., the result of calculating the constant temperature aging time is that the time required for the decomposition reaction to proceed to 20 % is 0.54 days.
Fig. 17 TG measurement results of insulating materials
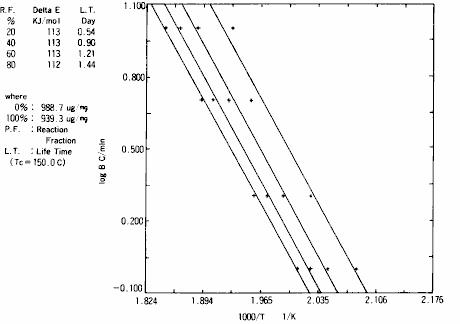
Fig. 18 theoretical analysis results of reaction activation energy
Application example of TMA
Measurement of glass transition of polyvinyl chloride
When TMA is used to measure polymer expansion and compression, the glass transition temperature can also be measured while measuring expansion rate.
The TMA measurement results of polyvinyl chloride with different concentrations of three plasticizers ( DOP ) are shown in fig. 19.In TMA method, the glass transition phenomenon can be observed as the change of expansion rate.The glass transition temperature ( Tg ) can be determined from the temperature at which the expansion rate changes.As can be seen from the results of fig. 19, when plasticizer is added to polyvinyl chloride, the glass transition temperature also moves to the low temperature side with the increase of plasticizer concentration.
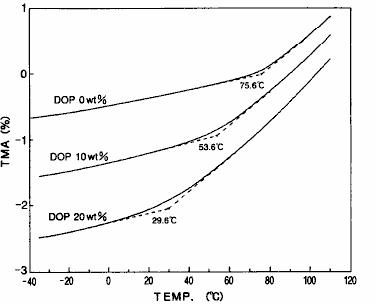
Fig. 19 TMA measurement results of polyvinyl chloride
Measurement of Polymer Films Using Needle - in Probes
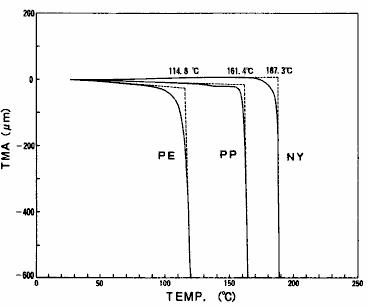
The softening temperature of polymer can be grasped by TMA measurement with needle probe.The process of penetration of the front end of the needle probe through the sample can be observed when the sample subjected to a certain load starts to soften during the heating process.The displacement start temperature at this time is the softening temperature.If the sample is a thin film or the like, the thickness of the thin film can also be determined according to the displacement amount.The needle penetration measurement results of polyethylene ( PE ), polypropylene ( PP ) and nylon ( ny ) are shown in fig. 20.From this result, it can be observed that the softening temperature varies with the type of polymer.
Fig. 20 results of needle penetration measurement of polymer film
The anisotropy of thermal expansion and contraction
TMA method basically only measures the change of sample size in a single direction.However, due to the difference in material, composition and structure of the sample, there may be differences in the behavior and size of thermal expansion and contraction in different measurement directions ( loading directions ).This property, which has different material properties in different directions, is called anisotropy and can be understood by TMA measurement.The measurement results of expansion and contraction of the printed circuit board ( glass fiber reinforced epoxy substrate ) in three directions are shown in fig. 21.From this result, it can be seen that the thermal expansion behavior is different with different measurement directions.It can also be seen from the measurement results that the change of expansion rate around 130 ℃ - 150 ℃ is caused by glass transition of epoxy resin, the main component of printed circuit board.The tensile measurement results of the polyethylene film are shown in fig. 22.This is the result of measuring the extension direction and the vertical direction of the film respectively.Since the molecules are arranged along the extension direction in the film making process of polymer film, the physical properties of the film in the extension direction and its vertical direction are different.From the results in fig. 22, it can be seen that the elongation in the extension direction is larger than that in the vertical direction, and there is a shrinkage behavior just before melting.
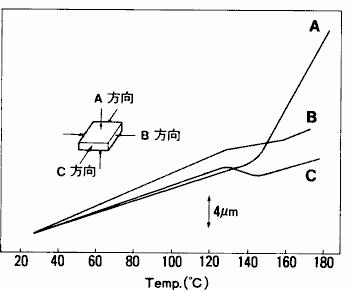
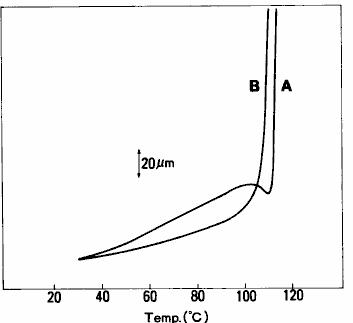
Fig. 21 measurement results of expansion and compression of printed circuit board
Fig. 22 tensile measurement results of polyethylene film a: extension direction b: vertical direction


 +86 18273288522